AXIS▲DESK
An open Nasdaq futures desk · run by Jordan Dallas

See the work.

An open Nasdaq futures desk, with the walls off. The 9 O'Clock brief before every bell. I trade the board live in the room, twice a week or more. The full journal goes with it: every entry, why I took it, the ideas that never made the cut and the ones that died in testing. Plus the Weekly Drop. One method, the Day Map, built on the whole tape. And one room where I'm held to the same standard as everybody in it.

TickCME futures at tick resolution, tested end to end
10 yrsof every listed U.S. option — chains, open interest, trades
Every sessionof the live NQ order book, recorded since July 2025
EV-testednothing ships on hit rate alone
The problem

Every trader is told to have a plan. Nobody hands them the day.

Every Nasdaq session has a shape — the open, the hold at eleven, the afternoon, the night. The market's own record will tell you, before it opens, which days today resembles and what those days did. Not a prediction. A map. So I built the desk that reads it. It is now open to other people.

Most people who trade futures lose money. Anyone who hides that sentence is selling you something. It's on my front page, and it's why nothing here is a signal: you get evidence and context, and the decisions stay yours.

The method

The Day Map.

How an NQ session actually unfolds: pre-open, the opening range, the 11 o'clock test, the afternoon, then the Globex night. Every one of those anchors tested against the market's own record, on the tape at tick resolution and a year of recorded order book. What held. What died. Where the day usually pays. One idea you can hold in your head for the whole session.
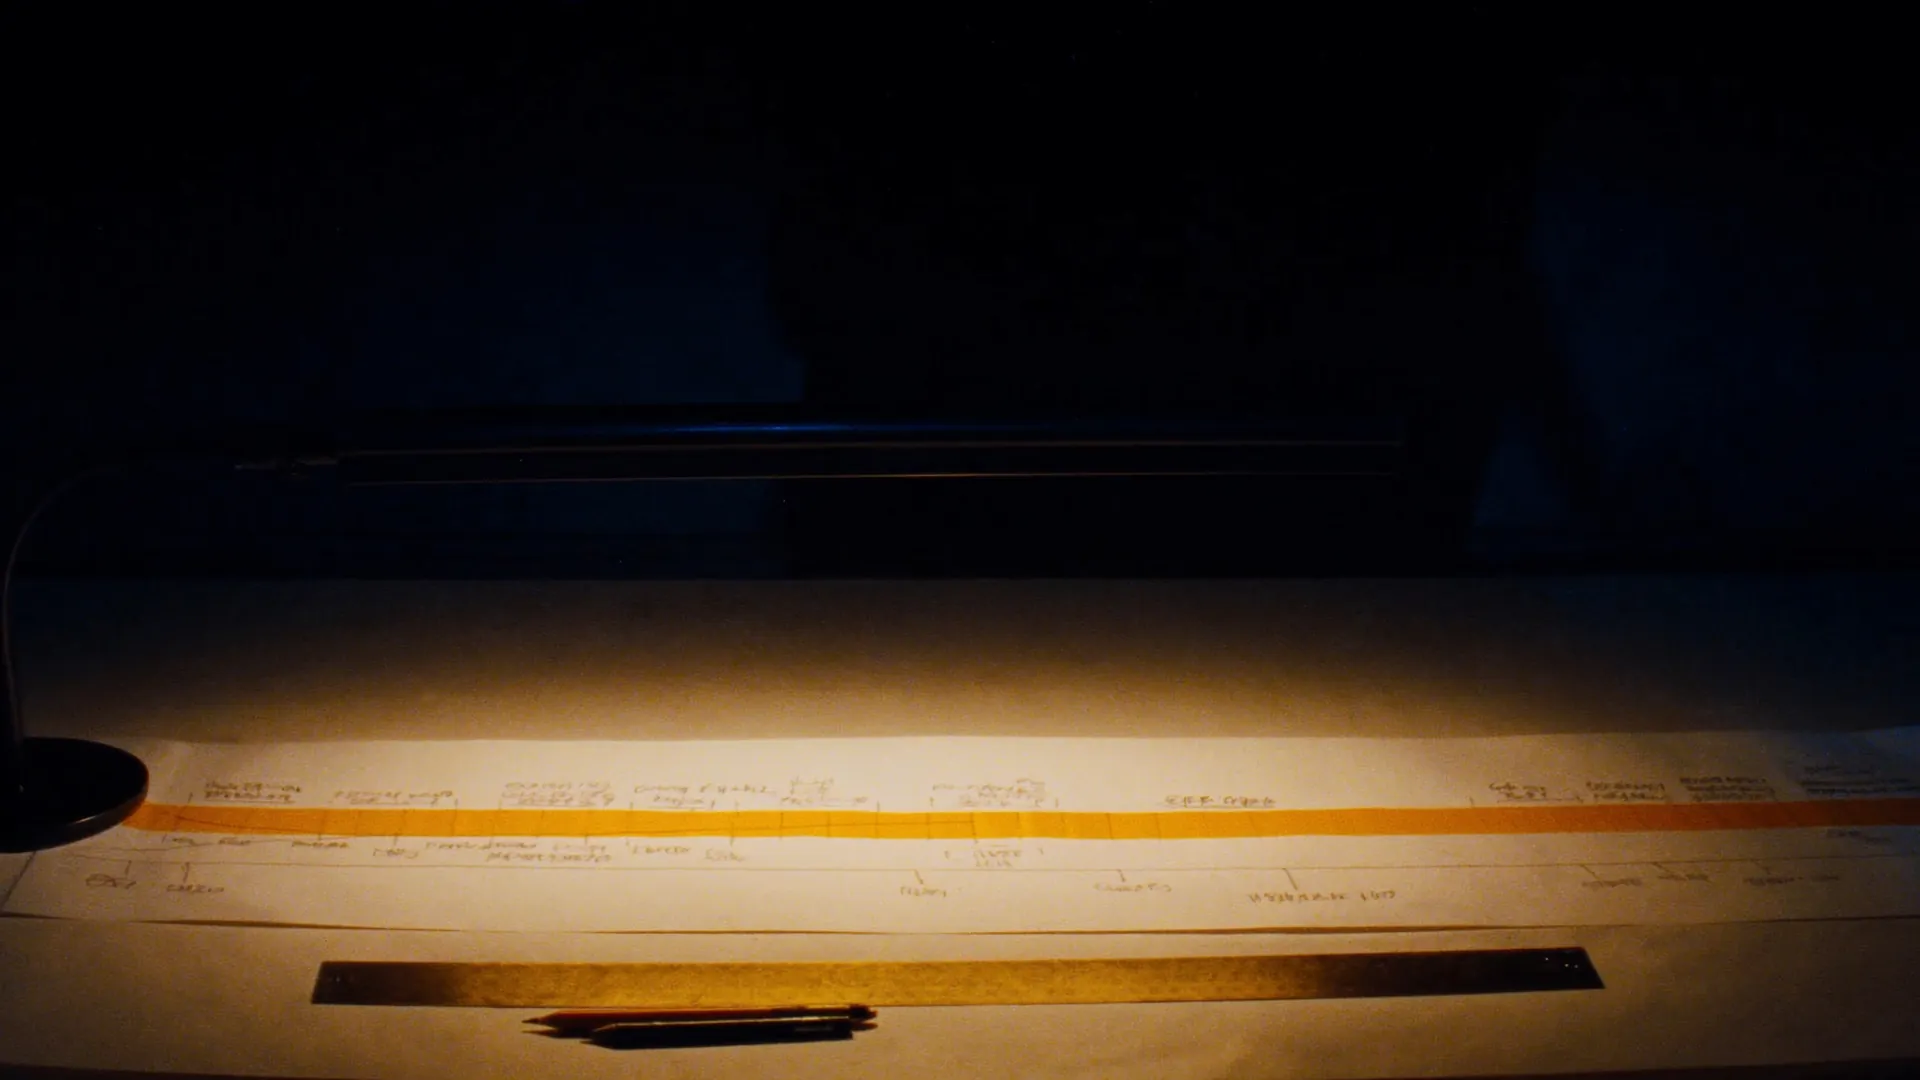
A session timeline drawn on vellum under a lamp; an amber band marks the opening range
The map on the table. The amber band is the opening range.
Anchor 01

The opening range

NQ day-range structure across the desk's full sample, tested against every candidate anchor. The one most traders lean on — settlement — graded out worst. The opening range graded out first.

Kept
Anchor 02

The 11 o'clock hold

If the morning has held above the 9:00 open into 11:00, the afternoon has paid: about +0.30R a trade over 603 sessions, positive every year since 2020. The mirror short fails; re-entering after a morning stop-out fails.

Kept
Anchor 03

The 21:00 boundary

Of every candidate for where the overnight session really turns, 21:00 ET is the boundary the data supports; the 20:00 one everyone quotes is dead. Afternoon markup on a selling tape is the stable stat behind it.

Kept
The kill list

What I don't trade

Sixty-odd ideas tested and retired — settlement anchors, IB breakouts, the value-area 80% rule, whale sweeps, footprint inversions, CPI/NFP momentum, weekend gap fades. Published, so you never pay for them again.

Killed
Read the whole method — free →

How the desk reads a market

Three lenses on one auction.

The auction tells you what kind of day this is. The tape tells you what just happened in it. Dealer positioning tells you how hard it is likely to move. None of the three is a signal, and the desk publishes where each one stops being useful.

01 — The auction

Where trade concentrated.

Price advertises for volume. Value is where business actually got done, and a session is the market's attempt to find it again — balance, imbalance, migration, acceptance and rejection.

Measured here: the first hour sets about 60% of the day's entire range. Equilibrium is touched on most days, but a third of days never cross it once — and those are the trend days. "It's extended, so it must be done" has no support: continuation runs flat across the whole ladder, from a third of a percent out to two.

Where it stops. Location tells you where you are, not where you are going. The value-area gate was replicated here and then killed — it was distance wearing a costume. What survived is the ruler, not the location.

02 — The tape

Who had to cross the spread.

Delta, absorption, and the resting book: what actually traded, at whose initiative, and where size stopped moving price.

Measured here: delta correlates 0.53 to 0.66 with the bar it is in, and with nothing ahead of it. It was tested four independent ways — decile buckets, partial correlation against the bar's own return, run persistence, and conditioned at value-area levels — and came back null every time, sign-flipping out of sample. Absorption reads as a volatility proxy, not a direction.

Where it stops. The tape is present tense. It describes what just happened; it does not forecast. Resting liquidity is the one genuinely orthogonal variable on this desk, and it is still untested — which is why nothing here is sold on it.

03 — Dealer positioning

How hard the day can move.

Where options dealers are hedged, computed in-house from the options tape: the flip, the walls above and below, and what they do to realised volatility.

Measured here: long-gamma days run about 0.92× normal range, short-gamma about 1.13×, and that survives the volatility controls. Direction: null. The "70% of days are positive gamma" figure sold in courses failed replication.

Where it stops. Gamma sizes your stop. It never aims your trade. In the most negative-gamma conditions a stop keyed to average range is touched 47.5% of the time against 22.6% in the most positive — same stop, different market. That is a risk input, and it stays graded provisional until an after-costs test exists.

All three answer the same question: what kind of day is this. None of them answers what you should do about it at 10:42 on a Tuesday. That decision stays yours — the desk's job is that you make it with the auction, the tape and the dealer's hedge already in front of you.

The instruments

What the desk is built on.

Institutional-grade data, one engine that tests every idea the same way, and studies that publish their status — kept, killed, or provisional. Dealer positioning is measured here, not sold: it gets credit only for what price and volatility can't already explain.

CME futuresIndex, energy, metals — at tick resolution.
The U.S. options tapeA decade of every listed strike: chains, open interest, trades.
Cboe volatilityThe volatility indices — index and metals.
The order bookFull NQ market depth, recorded live every session since July 2025.
Open interest, dailyPer-strike deltas since Aug 2026 — the dataset nobody can backfill.
How a stat earns its place
  1. 01Incremental over a baseline. An idea gets credit only for what the same day's drift and volatility don't already explain.
  2. 02Decision-time features, enforced in code. Nothing the trader couldn't have known at the moment of the trade.
  3. 03Placebos and shuffled nulls. The honest opponent isn't "always guess the base rate" — it's a market with the same volatility and no structure.
  4. 04Purged walk-forward. Every session scored only on data that came before it; a pre/post split that both halves have to survive.
  5. 05Expectancy, not hit rate. Realistic costs and stops. Win rate on its own has killed more accounts than it has funded.
  6. 06Percent, not points. The Nasdaq doubled since 2021; points-based stats quietly lie.

Sample, period, engine, null and split are stated on every drop. Cite it, argue with it, replicate it.

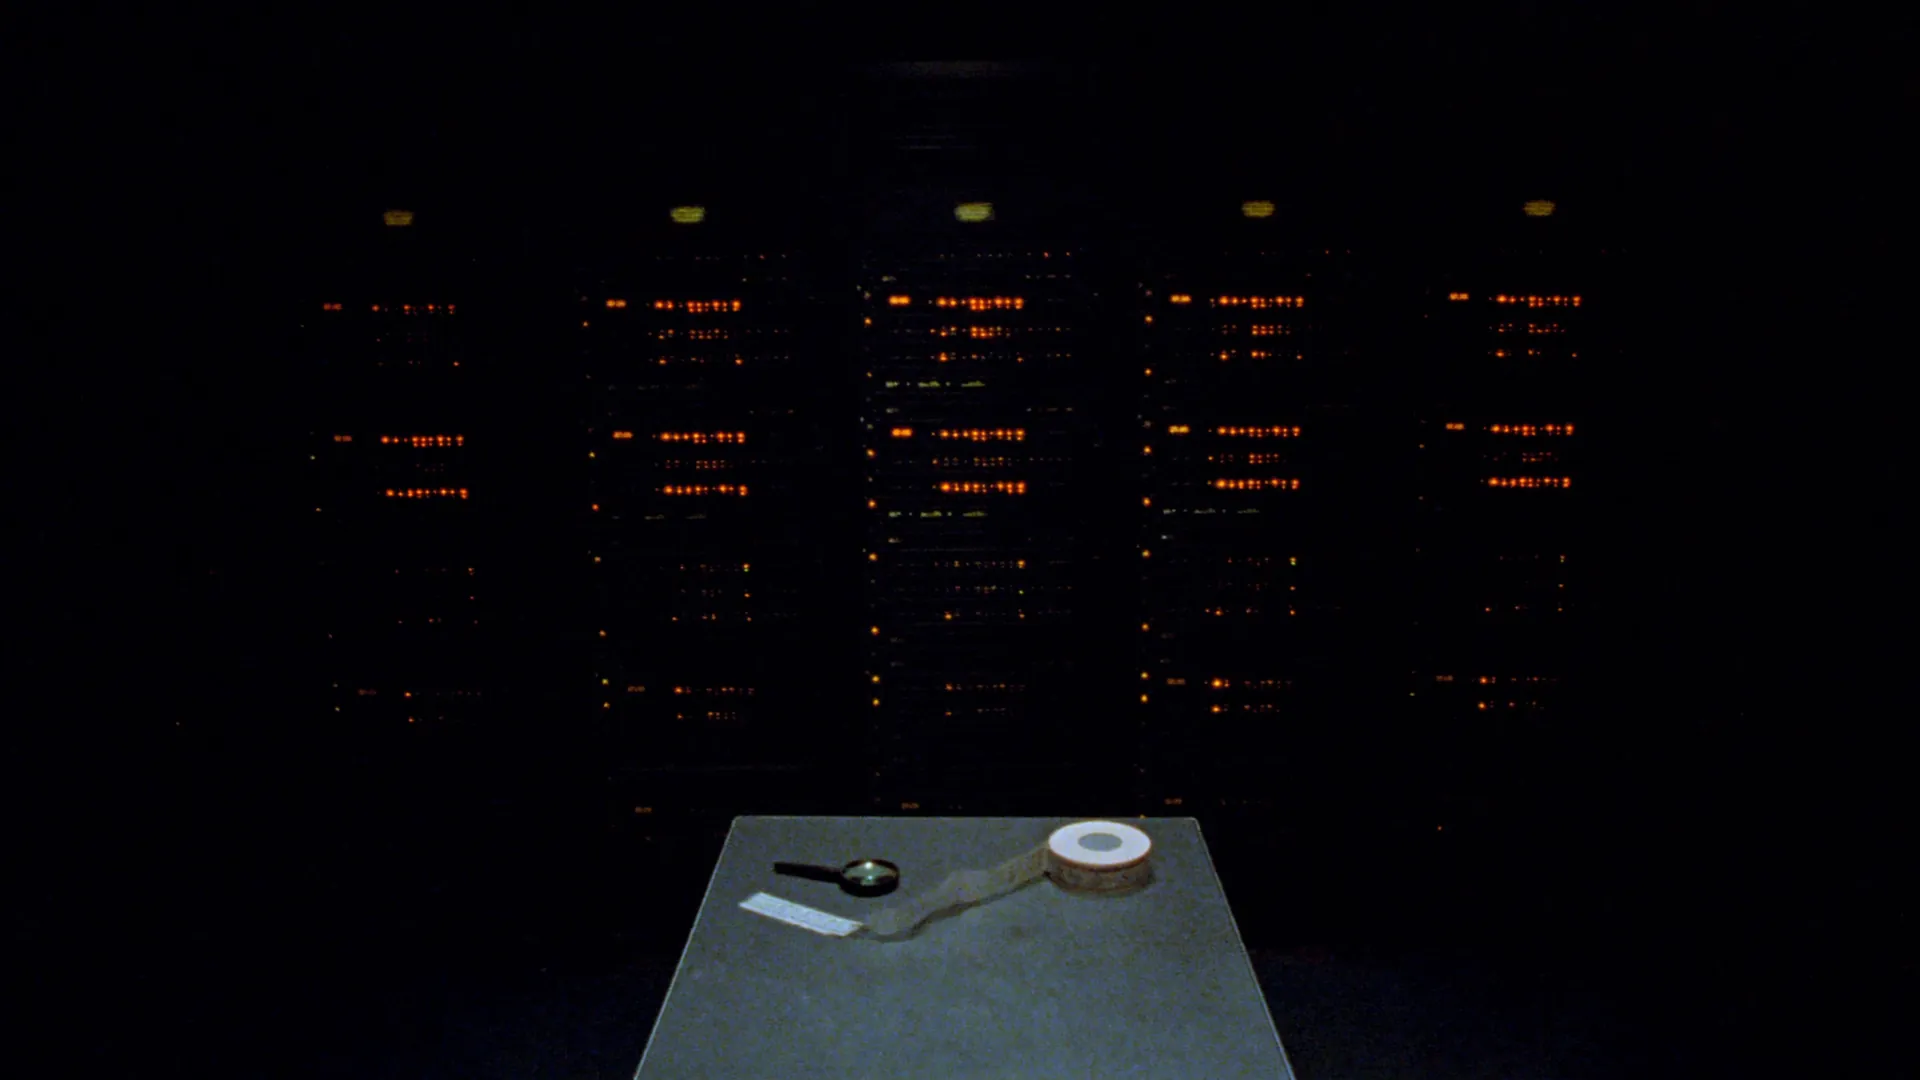
A dark data room with racks of amber status lights and a reel of ticker tape on a steel table
The archive · versioned like code
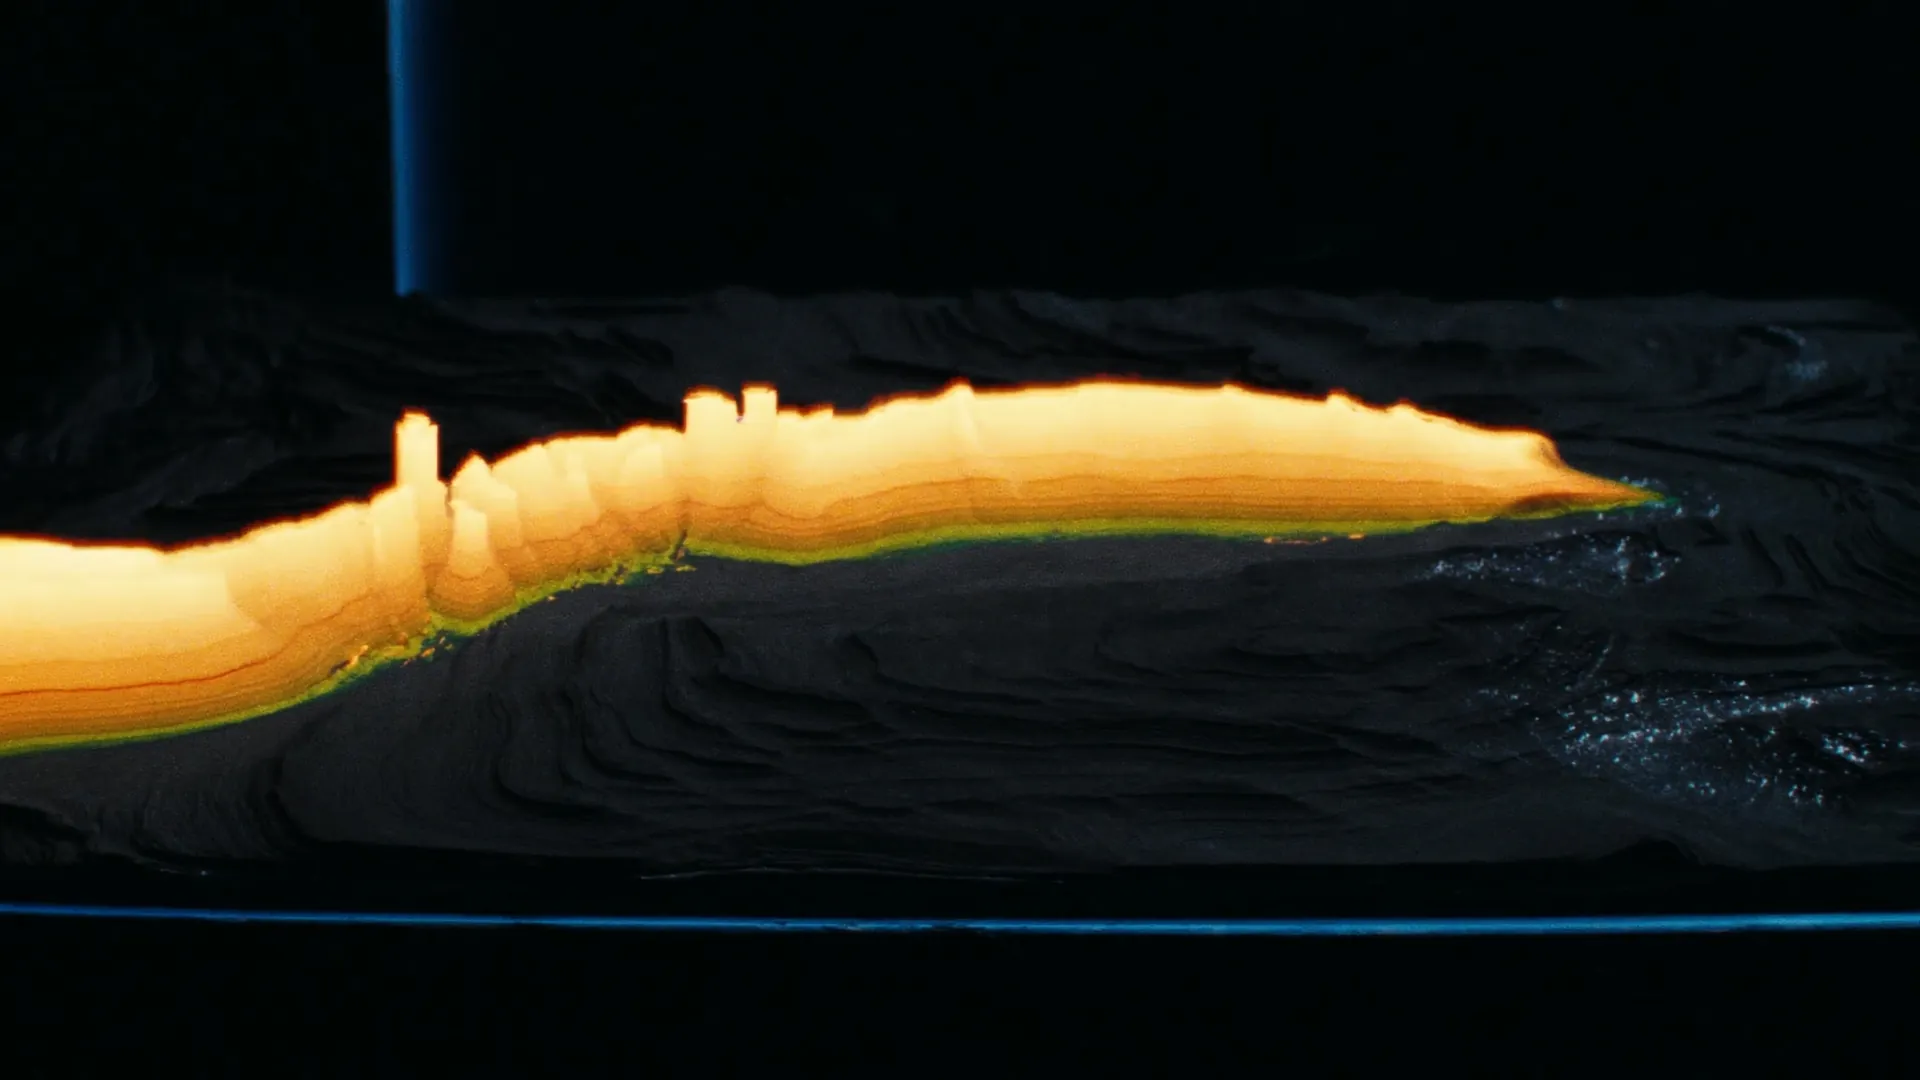
A dark topographic relief with one glowing amber ridge — a volatility surface
Dealer positioning · computed in-house
Kept

The Day Forecast

A range model for the session ahead, from the overnight range and recent volatility. 22% better than no view, 8% better than volatility alone, in both halves of the sample. It is where "typical travel" on The 9 O'Clock comes from.

Provisional

Dealer positioning

Computed from the options tape with the desk's own gamma engine. First result: long-gamma days run about 0.92× normal range, short-gamma about 1.13× — and it survives the volatility controls. Direction: null. And the "70% of days are positive gamma" claim sold in courses failed replication here — it's a coin flip.

Kept

The Day Map

The opening range as the anchor that holds; the 11 o'clock hold; the 21:00 boundary. Settlement — the anchor most traders lean on — graded out worst.

Killed

The order book

A year of full depth, replayed and measured. Book features add nothing beyond price and volatility — the null nobody selling depth indicators will publish. The recording continues; the claim doesn't.

Killed

The Trust Curve

A validated "is that the high?" curve that turned out to be 97% a property of noise once tested against shuffled returns. Published as Drop 01, because the kill is worth more than the curve.

Kept

The Book

The desk's Sierra Chart layout — 24,056 color slots across eleven charts, set by one rule: every buy is green, every sell is red, nothing else is allowed a hue. Built low-arousal on purpose. Included with AXIS Studies.

Two ways in

The instruments, or the two of us.

AXIS Studies is the software: every study on the board, licensed to your Sierra Chart account. The Inner Circle is the desk itself: twelve traders, both builders, every week. The 9 O'Clock and the drops stay free.

Free · every trading day

The 9 O'Clock

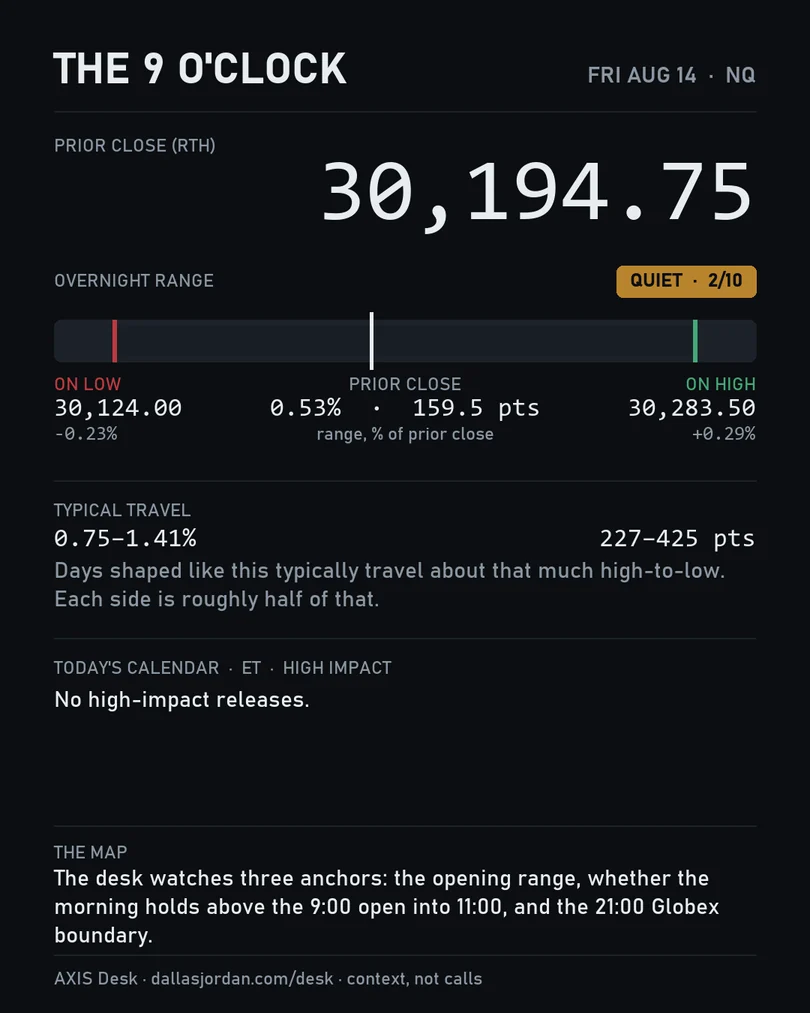
Today's map before the bell: where this day sits against every day like it on record, the overnight range read as quiet, normal or busy, the typical travel for days shaped like this, and the calendar. Two minutes to read. Inbox, the Discord, and @JDfutures. The drops are free too.

Free9:00 ET · Mon–Fri
Get The 9 O'Clock
01 · Monthly or yearly · Sierra Chart

AXIS Studies

$129 / monthor $1,290 / year — two months free

Every study on the desk's board, licensed to your Sierra Chart account. Whatever ships next is already included.

  • 01Order flow — Delta Candles, Rotation Legs, Liquidity Zones
  • 02The day's frame — Session Range, Overnight Projection, Rotation Gauge, Day Extremes
  • 03State and risk — Regime State, Session Panel, Event Clock, and the Ratchet Stop with a session governor that locks you out after N round trips
  • 04The Book — the full AXIS layout as a Sierra chartbook, every buy green, every sell red
  • 05The members' chat, and setup help the day a study draws nothing
LICENSED TO YOUR SIERRA ACCOUNT · UPDATES INCLUDED · CANCEL ANY TIME
02 · Twelve seats · by application

The Inner Circle

$500 / monthor $2,500 / six months — $5,000 a year

A small group working directly with the two of us who build AXIS. Hands-on, every week — not a course.

  • Access
  • 01A live group call every week with both of us — your questions, your charts, the week ahead
  • 02A private channel with both of us. Ask, and get answered.
  • 03One private 45-minute call a month
  • The work
  • 04Your own trades reviewed, from your journal, in the group
  • 05The board traded live in the room through the week
  • 06Everything in AXIS Studies, installed with you on day one, and first access to every new study
  • What we ask of you
  • 07Show up, keep a journal, and be honest about your trading. This group only works if you do the work.
12 SEATS · THE FIRST TWELVE KEEP THEIR PRICE FOR LIFE WHILE THEY STAY · WE REPLY WITHIN 48 HOURS

Both are licensed to your Sierra Chart account name, which checkout asks for. A lapsed licence keeps working until Sierra Chart is next restarted, so there is no free trial of the studies. The Inner Circle is by application: you are charged only if your seat is confirmed. A small number of panels on the desk's own board read from its research pipeline and cannot run on another machine; those are not part of either offer. Nothing here is a signal, and nothing here is a promise of profit. Futures trading carries substantial risk of loss, and most traders lose money.

The 9 O'Clock

Two minutes, every trading morning, before the bell.

The desk already writes itself a brief at 9:00. This is the public copy: the overnight range in percent and points, read against the record of overnight ranges; the typical travel for days shaped like this; the calendar. No bias. No target. No call. Just the day, mapped, so you walk in knowing what kind of day the data says you're in.

Also posted daily to @JDfutures and the desk's Discord. Free. Unsubscribe any time.

The 9 O'Clock card for Fri Aug 14: prior close 30,194.75; overnight range 0.53% (159.5 pts), quiet, decile 2/10; typical travel 0.75–1.41%; no high-impact releases
The real card for Fri Aug 14, 2026 · rendered by the desk at 9:33 ET
Receipts

The Weekly Drop.

One tested finding a week, with the test attached — sample, period, engine, null, out-of-sample split, expectancy, and where it broke. If a finding died in testing, I publish that too. Dead stats teach. Written to be cited, argued with, and replicated.

All drops →

Free to read

Desk Notes.

Writing on the craft rather than the tape — process, risk, psychology, method. A note carries no stat that isn’t linked to the test that produced it; tested findings live in the Drop. Free, no email required.

All notes →

Standards

What you will never see here.

Standards are the things you say no to in public. These are the desk's, and they apply to me first.

Signal calls.

You'll see every trade I take and why I took it. That's a record of what I did, not an instruction for what you should do. Nobody here is going to tell you what to buy. What happens at the hard right edge is your trade.

P&L screenshots as marketing.

A cherry-picked green day is an ad, not evidence. My receipts are datasets and methods.

Lifestyle content.

No rented cars, no rented watches. The product is the work, and you get to watch it happen.

Countdown timers and "last chance" pricing.

If an offer is only good under pressure, it isn't good.

Hidden losses.

Studies that fail get published as nulls. Dead stats are half the value of a library.

A promise you'll be profitable.

Nobody honest can make it. I can promise you the standard, the receipts and the room.

Borrowed authority.

No vendor logos as proof and no "institutional" without receipts. The data reach is stated plainly above; the tests are on every drop.

Most people who trade futures lose money. Anyone who hides that sentence is selling you something. I put it on the front page.

Who runs it

Jordan Dallas.

Nine years in the markets — crypto, then forex, then futures — the last of them on one instrument, studied properly. The desk went systematic in 2024: the whole tape at tick resolution, an order book recorded session by session, and a rule that every idea gets tested before it touches money and the failures get published too. AXIS Desk opens that desk to other people. He is in the room every day the market's open, and the same standard applies to him.

The rest of the office — the holdings, the ventures, the art — is at dallasjordan.com. Press kit here.

The Inner Circle

Every trader has a desk. Most have never seen a good one. Sit at ours.

The Inner Circle is twelve seats, by application, at $500 a month, and the first twelve keep that price for life while they stay. When the seats are full, a seat opens only when someone leaves. Checkout is handled by Whop and asks for your Sierra Chart account name. Just want the instruments? AXIS Studies is $129 a month.

Want to see the room first? Join the Discord → — the public channels and The 9 O'Clock are free. Not ready for either? Start with The 9 O'Clock.